
All Tableau classes include
 Free retake
 Detailed curriculum
 Live instructor
 Flexible rescheduling
 Certificate of Completion
 Small class sizes
 Course recording
What you learn in this introductory Tableau course
- Data and visualization fundamentals: Understand how data is organized, where business data is commonly found, and how visualizations help answer questions.
- Tableau fundamentals: Learn how Tableau Desktop works with Tableau Cloud, Tableau Server, Tableau Public, and other parts of the Tableau platform.
- Data connections: Connect to Excel, CSV, text, and other common data sources and understand the difference between live connections and extracts.
- Data preparation: Use Tableau tools to review field names, data types, null values, geographic information, and the structure of a dataset.
- Data organization: Use Data Interpreter, pivots, relationships, joins, and unions to prepare data for analysis.
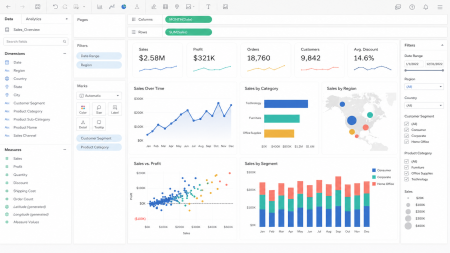
- Visual analysis: Create tables, bar charts, line charts, treemaps, scatter plots, maps, and other common visualizations.
- Calculations and aggregation: Work with aggregations such as sum, average, minimum, maximum, and count, and create basic calculated fields.
- Sorting and filtering: Sort, group, filter, and organize information so that visualizations focus on relevant data.
- Formatting and interaction: Use color, size, detail, labels, tooltips, filters, and formatting controls to improve and customize visualizations.
- Dashboard and story creation: Combine worksheets into dashboards and stories that present information clearly and support user interaction.
- Sharing Tableau work: Save, package, print, export, and publish Tableau visualizations and workbooks.
Tableau training course - introduction - Course Dates
All classes are led by a live instructor. Class times listed are Eastern time.
Tableau training course - introduction
Weekdays
Mon, Nov 02 2026 and Tue, Nov 03 2026
10:00 am to 5:00 pm
Tableau training course - introduction
Weekdays
Mon, Dec 07 2026 and Tue, Dec 08 2026
10:00 am to 5:00 pm
Tableau training course - introduction
Weekdays
Mon, Jan 11 2027 and Tue, Jan 12 2027
10:00 am to 5:00 pm
Tableau training course - introduction
Weekdays
Tue, Feb 16 2027 and Wed, Feb 17 2027
10:00 am to 5:00 pm
Tableau training course - introduction
Weekdays
Mon, Mar 22 2027 and Tue, Mar 23 2027
10:00 am to 5:00 pm
Tableau training course - introduction
Weekdays
Mon, Apr 26 2027 and Tue, Apr 27 2027
10:00 am to 5:00 pm
Tableau training course - introduction
Weekdays
Tue, Jun 01 2027 and Wed, Jun 02 2027
10:00 am to 5:00 pm
Tableau training course - introduction
Weekdays
Tue, Jul 06 2027 and Wed, Jul 07 2027
10:00 am to 5:00 pm
Tableau training course - introduction
Weekdays
Mon, Aug 09 2027 and Tue, Aug 10 2027
10:00 am to 5:00 pm
Tableau training course - introduction
Weekdays
Mon, Sep 13 2027 and Tue, Sep 14 2027
10:00 am to 5:00 pm
Tableau training course - introduction
Weekdays
Mon, Oct 18 2027 and Tue, Oct 19 2027
10:00 am to 5:00 pm
Tableau training course topics - introductory class
Day 1: Understanding Data and Creating Visualizations
Understanding data and visual analysis
- Understanding what data is and how it is used
- Recognizing records, fields, dimensions, and measures
- Identifying common sources of organizational data
- Understanding structured and unstructured data
- Recognizing characteristics of analysis-ready data
- Translating a business question into an analytical question
- Understanding how visualizations reveal comparisons, patterns, trends, and outliers
- Selecting visualizations based on the information being communicated
- Avoiding misleading or unnecessarily complicated visualizations
Getting started with Tableau
- Understanding common uses for Tableau
- Reviewing the Tableau product environment
- Distinguishing Tableau Desktop, Tableau Cloud, Tableau Server, and Tableau Public
- Understanding the basic Tableau workflow
- Opening Tableau and reviewing the start page
- Connecting to a sample dataset
- Creating a first visualization
- Saving a Tableau workbook
Navigating the Tableau Desktop workspace
- Working with workbooks, worksheets, dashboards, and stories
- Navigating the Data and Analytics panes
- Understanding shelves, cards, fields, and pills
- Working with the Marks card
- Understanding dimensions and measures
- Recognizing discrete and continuous fields
- Understanding blue and green fields
- Using the Show Me panel
- Changing the visualization suggested by Show Me
- Undoing, redoing, reverting, and saving work
- Duplicating and renaming worksheets
Connecting to and reviewing data
- Identifying data needed for an analysis
- Connecting to Excel workbooks
- Connecting to CSV and text files
- Reviewing other available data connectors
- Understanding common file and data formats
- Reviewing tables on the Data Source page
- Previewing records and source information
- Understanding live connections and extracts
- Creating and refreshing an extract
- Assigning and correcting data types
- Renaming and hiding fields
- Working with aliases
- Assigning geographic roles
- Recognizing null, missing, and incomplete values
- Refreshing a data connection
Preparing and structuring data
- Understanding how data should be structured for Tableau
- Recognizing headers, field names, records, and summary rows
- Using Data Interpreter to identify usable data
- Removing unnecessary headers and formatting from imported data
- Splitting combined values into separate fields
- Pivoting columns into rows
- Combining similarly structured data with unions
- Understanding the purpose of relationships
- Reviewing the basic difference between relationships and joins
- Recognizing when multiple tables are needed
- Confirming totals and record counts after preparing data
Creating foundational visualizations
- Starting a visualization with an analytical question
- Creating a text table
- Creating a highlight table
- Creating bar and stacked bar charts
- Creating line and area charts
- Visualizing changes over time
- Creating treemaps
- Creating scatter plots
- Changing mark types
- Using Show Me to explore appropriate chart options
- Applying fields to Color, Size, Label, Detail, and Tooltip
- Changing the aggregation applied to a measure
- Editing axes, headers, and titles
- Duplicating and modifying a visualization
- Comparing different visual approaches to the same data
Sorting, grouping, and filtering data
- Sorting data manually
- Sorting by field values
- Creating groups from related values
- Creating bins for numeric data
- Building and using hierarchies
- Drilling into and out of hierarchical information
- Filtering categorical values
- Filtering numeric measures
- Filtering dates and date ranges
- Keeping or excluding selected marks
- Displaying interactive filter controls
- Customizing the appearance of a filter control
- Selecting single-value and multiple-value filter options
- Applying a filter to multiple worksheets
- Clearing and resetting filters
Day Two: Calculating, Formatting, and Sharing Results
Working with calculations and aggregations
- Understanding how Tableau aggregates data
- Working with
SUM,AVG,MIN,MAX, andCOUNT - Changing the aggregation used for a measure
- Understanding row-level and summarized values
- Creating a calculated field
- Performing arithmetic calculations
- Creating ratios and percentages
- Building basic conditional calculations
- Using simple
IFstatements - Working with basic date calculations
- Handling null values in calculations
- Editing and validating calculated fields
- Applying calculated fields to a visualization
- Using quick table calculations
- Calculating percent of total
- Creating running totals and differences
- Adding totals and subtotals
- Confirming that calculated results are reasonable
Enhancing and Interacting with Visualizations
- Navigating Tableau’s formatting tools and menus
- Formatting an entire worksheet
- Formatting specific fields and parts of a view
- Formatting numbers, percentages, currency, and dates
- Editing fonts, alignment, lines, borders, and shading
- Editing and formatting axes
- Adjusting axis ranges and tick marks
- Formatting headers and gridlines
- Using color to categorize or emphasize data
- Applying accessible and consistent color choices
- Changing mark size
- Adding fields to the Detail property
- Displaying and formatting mark labels
- Creating and customizing tooltips
- Adding explanatory text to tooltips
- Creating annotations for marks, points, and areas
- Highlighting selected values
- Adding reference lines
- Adding basic trend lines
- Reducing unnecessary visual elements
- Maintaining consistency across worksheets
Working with dates and geographic data
- Understanding Tableau date fields
- Distinguishing date parts from date values
- Changing date granularity
- Working with year, quarter, month, week, and day
- Creating continuous and discrete timelines
- Reviewing calendar and fiscal dates
- Assigning geographic roles
- Correcting unrecognized geographic locations
- Creating symbol maps
- Creating filled maps
- Using size and color to represent geographic values
- Adding geographic details and tooltips
- Filtering a geographic visualization
Creating dashboards
- Understanding the purpose of a dashboard
- Identifying the audience and purpose of a dashboard
- Selecting worksheets for a dashboard
- Creating a first dashboard
- Selecting fixed, range, or automatic dashboard sizing
- Adding worksheets, text, images, and navigation objects
- Understanding tiled and floating objects
- Working with horizontal and vertical layout containers
- Adding filters and legends
- Applying filters across dashboard views
- Using a worksheet as a dashboard filter
- Creating basic filter actions
- Creating highlight actions
- Adding navigation between dashboards
- Editing dashboard titles and supporting text
- Testing dashboard interactions
- Designing dashboard layouts for different displays
- Reviewing device-specific layouts
Creating stories and presenting findings
- Understanding the difference between a dashboard and a story
- Identifying the central message of an analysis
- Organizing information to guide the audience
- Creating a first Tableau story
- Adding worksheets and dashboards to story points
- Adding and updating story points
- Sequencing information to explain a finding
- Using titles, captions, annotations, and tooltips to provide context
- Presenting comparisons and trends accurately
- Distinguishing correlation from causation
- Reviewing a story for clarity and consistency
Saving, printing, exporting, and publishing
- Understanding Tableau workbook and data-source files
- Working with
.twbworkbook files - Working with
.twbxpackaged workbook files - Understanding Tableau extract files
- Saving and packaging a workbook
- Checking whether a packaged workbook contains required data
- Previewing worksheets and dashboards for printing
- Configuring page setup and print options
- Printing worksheets and dashboards
- Exporting visualizations as images
- Exporting worksheets and dashboards to PDF
- Exporting presentation content
- Exporting summarized or underlying data
- Understanding basic publishing options
- Publishing to Tableau Cloud, formerly Tableau Online
- Publishing to Tableau Server
- Understanding the public nature of Tableau Public
- Avoiding the publication of confidential data to Tableau Public
- Sharing a published workbook
- Reviewing a workbook before distribution
Creating and sharing an interactive Tableau dashboard
Participants complete a guided project that includes:
- Identifying the analytical purpose of a dataset
- Connecting to and reviewing the source data
- Preparing fields for analysis
- Creating several complementary visualizations
- Using calculations, sorting, and filters
- Formatting charts and customizing tooltips
- Combining visualizations into a dashboard
- Adding basic dashboard interactivity
- Creating a story point or presentation view
- Preparing the completed workbook for export or publication
Tableau course instructors
AGI instructors are Tableau professionals and skilled teachers. You'll learn from a live Tableau professional that brings years of experience that will help you learn Tableau quickly and easily.

Fred
MIT, Data Science
SCRUM Master
Certified Technical Trainer

Shirley
MLA, Harvard
MS, Bentley
BS, Bentley

Grace
MS, Information Design
BA, Digital Communications
Adjunct Professor, St. Olaf

Jennifer S.
MS, Human Factors Information Design
BA, Commercial Art
UXQB Certfied
Adjunct Professor, Boston University
Custom and private Tableau classes
This Tableau course is available as a private class. Curriculum can be customized for your specific needs. Tableau classes can be delivered at your location, online, or in our classrooms. For more information, call 781-376-6044 to speak with a training consultant or contact us.
We recommend that you have Tableau before starting this class.
You will receive a comprehensive course manual for this class developed by the certified instructors at AGI. AGI instructors have created many of the official training guides and books for Adobe Systems and Microsoft.